Crypto Market Commentary & Outlook
(July 12 – 2021)
Bitcoin (BTC) Technical Analysis & Outlook
On a slow summer news day with very light trading volumes price is defaulting to its bearish shorter-term bias with price bleeding below the $33k level on weak technicals and poor sentiment, so we think our plan of staying on the sidelines remains the right call over the coming days. That said, we are expecting volatility to return with a vengeance in the not too distant future as many indicators are suggesting a directional squeeze, although determining which direction the action will be in is still very difficult but we’ll try to glean some clues on the charts below.
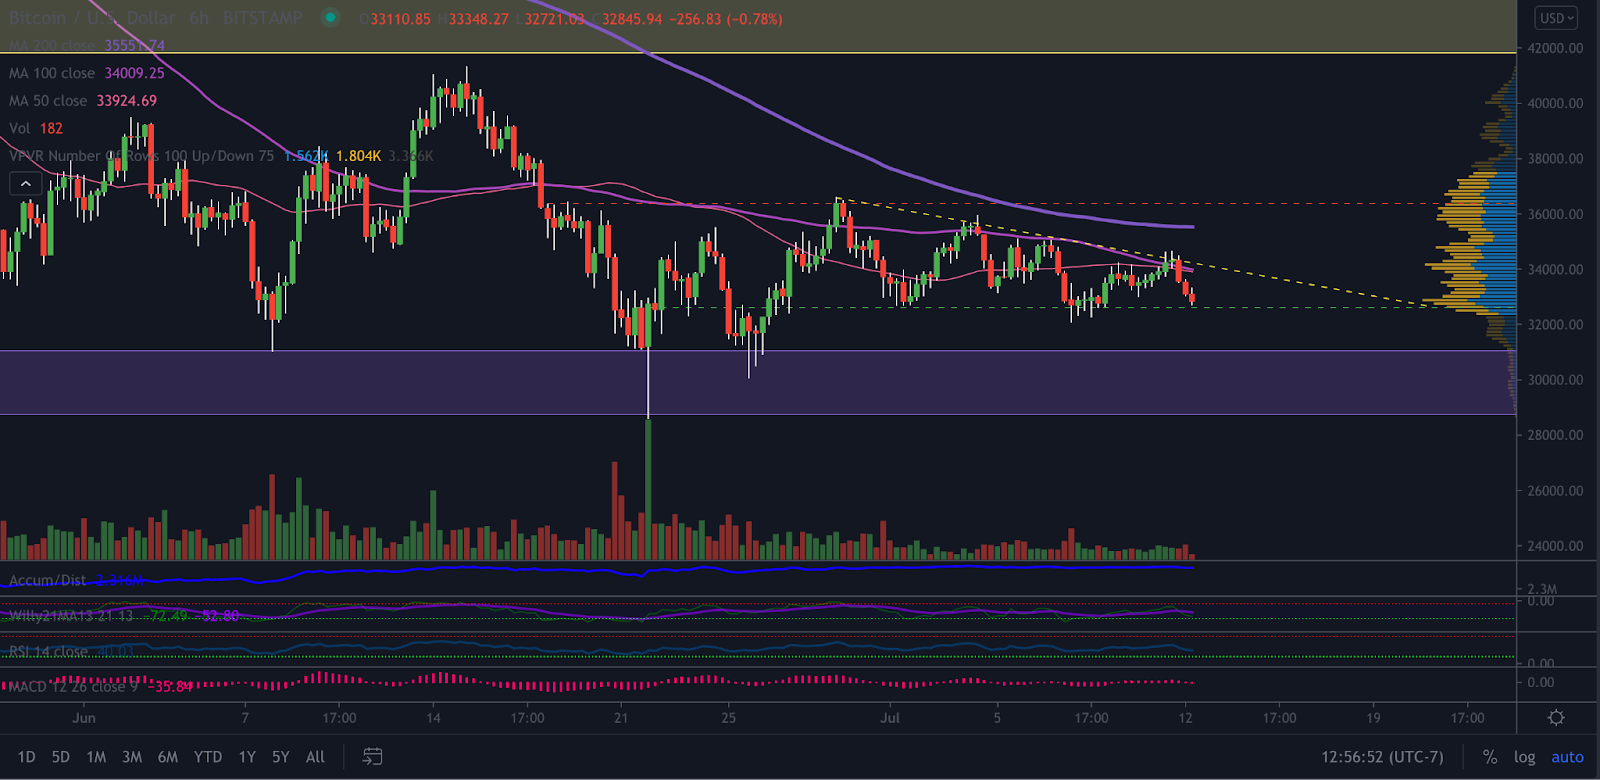
TradingView Bitstamp BTC/USD 6-hour linear chart
We’ll zoom back into the 6-hour chart today where we can see that price has moved down to the range support line following a rejection at the still falling 50 and 100 SMA’s late last week which is putting pressure on an already heavy market structure setup while a near-term descending triangle forms, all pointing to a bearish bias over the coming days. The still recharging momentum oscillators and the recent downtick in the A/D line are also fairly discouraging near-term signals, so a test of the top of the upper demand area in the $31k area appears to be increasingly likely this week.

TradingView Bitstamp BTC/USD daily linear chart
We’ll also take a look at the daily chart for a view of the medium-term technicals where we can see that price is still treading water around the top of the upper demand area and in the middle of the descending channel on very mixed candle formations and highly uncertain short-term market structure, so for now it looks like the consolidation will continue for at least another day or two before the volatility returns. That said, the recent bearish 100/200 SMA cross, the still falling 50 SMA, and another RSI trendline rejection are all suggesting that the bears are still in control and therefore have a slight upper hand going into a potential volatility squeeze later this week.
Trade Idea: Accumulate below $32k for upside to the $40k area. Longer-term target resides around $100,000.
Monero (XMR) Technical Analysis & Outlook
XMR/BTC

TradingView Binance XMR/BTC daily linear chart
XMR/BTC continues to consolidate above the top of the OTE long zone trying to form what appears to be a double bottom on mixed candle formations but still intact longer-term market structure while the momentum oscillators stabilize following a full recharge recently, so the bulls have something to work with this week. Conversely, the bearish 50/100 SMA cross that will confirm in the next day or two, the still falling 200 SMA, the deteriorating A/D line, and still bearish shorter-term market structure all point to a test of sub-0.0060 levels before a bounce materializes therefore we’ll stay patient for those lower levels for now.
Trade Idea: Accumulate below 0.0060 for upside to 0.0070. Longer-term target resides in the 0.0120 area.
XMR/USD

TradingView Bitfinex XMR/USD daily linear chart
XMR/USD continues to tread water in the middle of the descending triangle on a fairly bearish candle formation today that is keeping shorter-term market structure bearish and heavy while the 50 SMA starts to move further below the 200 SMA, all bad news for the bulls moving forward. The falling 100 SMA and the lackluster momentum and volume indications are also near-term bearish signals, however we expected support in the $180 – $200 area to be quite strong in terms of support so we’ll keep powder dry for lower levels this week.
Trade Idea: Accumulate below $200 for shorter-term upside to the $250 area. Longer-term target resides around $1000.
ZCash (ZEC) Technical Analysis & Outlook
ZEC/BTC

TradingView Binance ZEC/BTC 3-day linear chart
ZEC/BTC is on the verge of breaking down below the bottom of the symmetrical triangle given small but bearish candle formations over the past few days while shorter-term market structure remains bearish and heavy, so we think said breakdown is highly likely at some point in the near future. The imminent bearish 50/100 SMA cross, the falling 200 SMA, and the discouraging volume indications also point to a move lower over the coming days, however the momentum oscillators are recharged, MACD is bullishly divergent, and support should be very strong in the support confluence just below 0.0030 which is where we’ll keep powder dry for moving forward.
Trade Idea: Buy dips below 0.0030 for shorter-term upside to the 0.0045 area. Longer-term target resides around 0.0080.
ZEC/USD
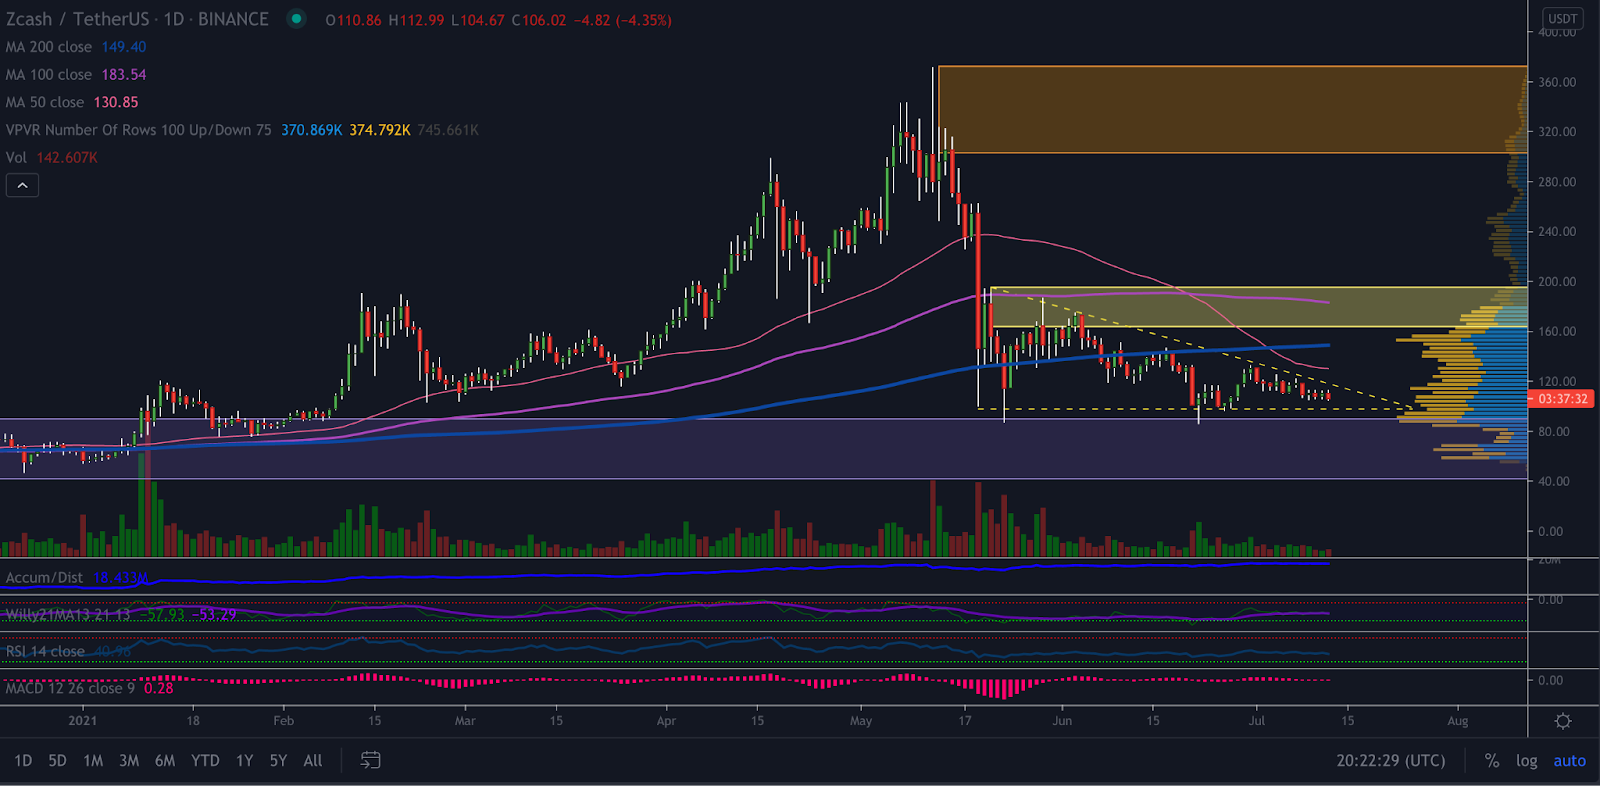
TradingView ZEC/USDT daily linear chart
ZEC/USDT is still trading inside of the descending triangle on a hodgepodge of candle formations and still bearish shorter-term market structure while the 50 SMA falls further below the 200 SMA and the 100 SMA starts to pick up some steam to the downside, none of which bodes well for the bulls over the shorter-term. The lackluster momentum oscillators won’t help the situation for the bulls over the coming days, so a test of sub-$100 prices is likely this week, although we expect support to remain strong below $100, and especially below $90, which is where we want to start to add to positions again moving forward.
Trade Idea: Accumulate below $100 for upside to the $175 area. Longer-term target resides around $300.
Pirate Chain (ARRR) Technical Analysis & Outlook
ARRR/BTC
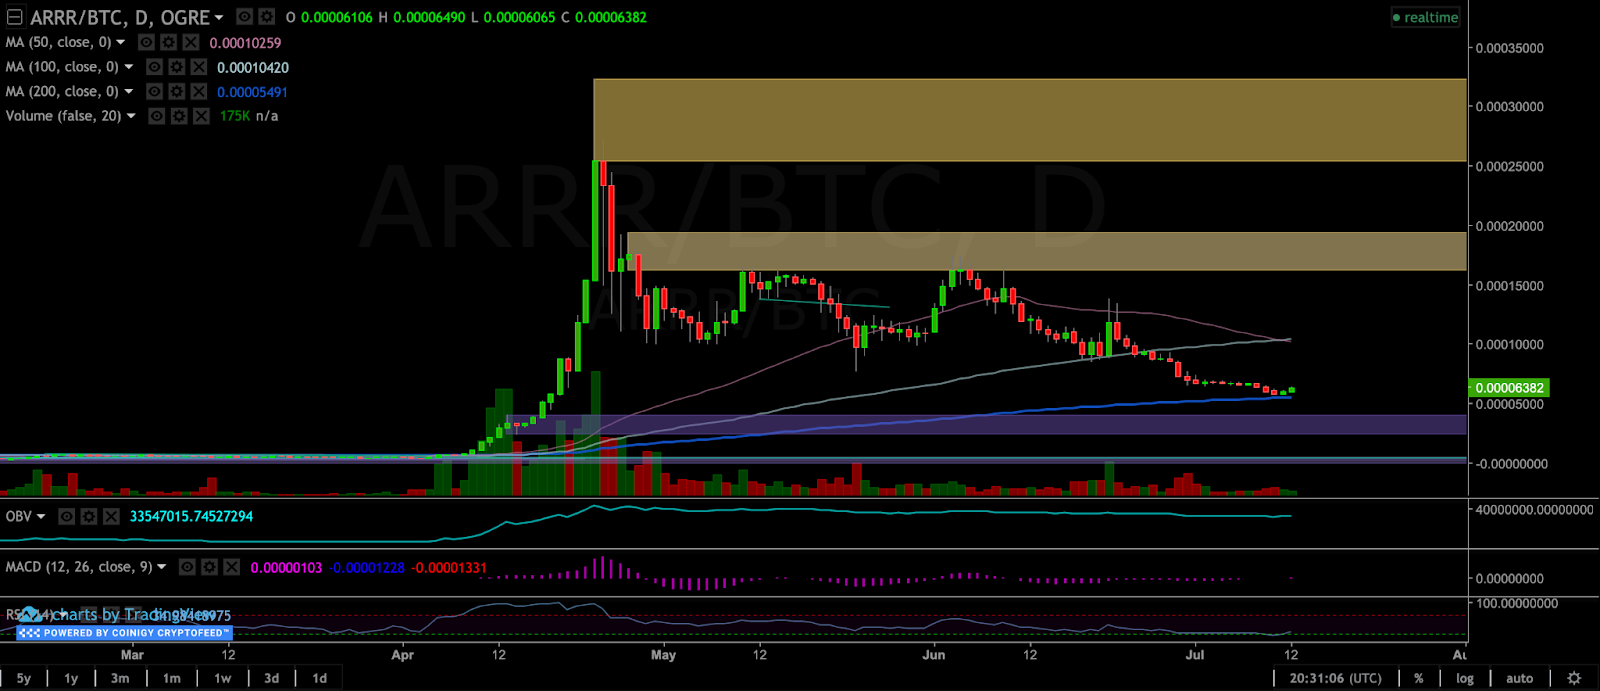
Coinigy TradeOgre ARRR/BTC 3-day linear chart
ARRR/BTC finally touched the still slowly rising 200 SMA over the weekend as expected on small but firmly bearish candle formations and still broken medium-term market structure while a bearish 50/100 SMA cross gets within a day or two of confirmation, certainly not great news for the bulls moving forward. Having said that, we have seen a small bounce recently thus sparking some favorable candles while OBV ticks up for the first time since early June and the momentum oscillators are recharged and bullishly divergent so we think we’re getting close to a sustainable bottom, either here around 0.00050 or slightly lower in the 0.00040 region.
Trade Idea: Accumulate below 0.00050 for shorter-term upside to the 0.00100 area. Longer-term target resides around 0.00500.
ARRR/USD

CoinTradePro CoinPaprika ARRR/USD daily linear chart
While ARRR/USD continues to trade within the descending wedge we think we’ll see a break from the pattern this week given price is very near the formation’s apex while also being very close to the bottom of the upper demand area while the momentum oscillators look ready for a bigger move, and given the steady state of the OBV reading we think there is a slightly better chance of a breakout higher than a breakdown lower at this time. That said, we would not be surprised to see price falsely break lower first to truly test sub-$2 before a strong rally higher which is why we’re still waiting for slightly lower prices before adding to current positions.
Trade Idea: Accumulate below $2 for upside to the $4 area. Longer-term target resides around $25.
Good Luck, Good Trading!