Crypto Market Commentary & Outlook
(June 2 – 2021)
Bitcoin (BTC) Technical Analysis & Outlook
On the eve of Bitcoin 2021 in Miami, a sold out event that is expected to host 50,000+ cryptomaniacs, the markets are looking and acting better than yesterday particularly from a shorter-term technical point of view. The hype and buzz around the conference will likely add to the bullishness over the coming days, however we are expecting a bit of a hangover this weekend and early next week, all of which remains in line with our call for more choppy consolidation, likely between between ~$35 – $42 over the next few weeks. That said, it is looking more and more like a sustainable bottom is in at $30k so we’re slowly turning more positive for the time being.

TradingView Bitstamp BTC/USD 6-hour linear chart
Given the price action over the past 24 hours we must return to the 6-hour chart where we can see that the symmetrical triangle has been broken to the upside on some encouraging candle formations that are shifting shorter-term market structure back to bullish, all of which are much better signs for the bulls than what we were working with yesterday. The break above the falling 50 SMA, the improving momentum oscillators, and volume indications that suggest buyers are still more active than sellers are also good signs for the bulls moving forward, although there is a key resistance line just overhead and the broken triangle will almost certainly need to be tested at some point, hence our call for some near-term weakness following Bitcoin 2021.
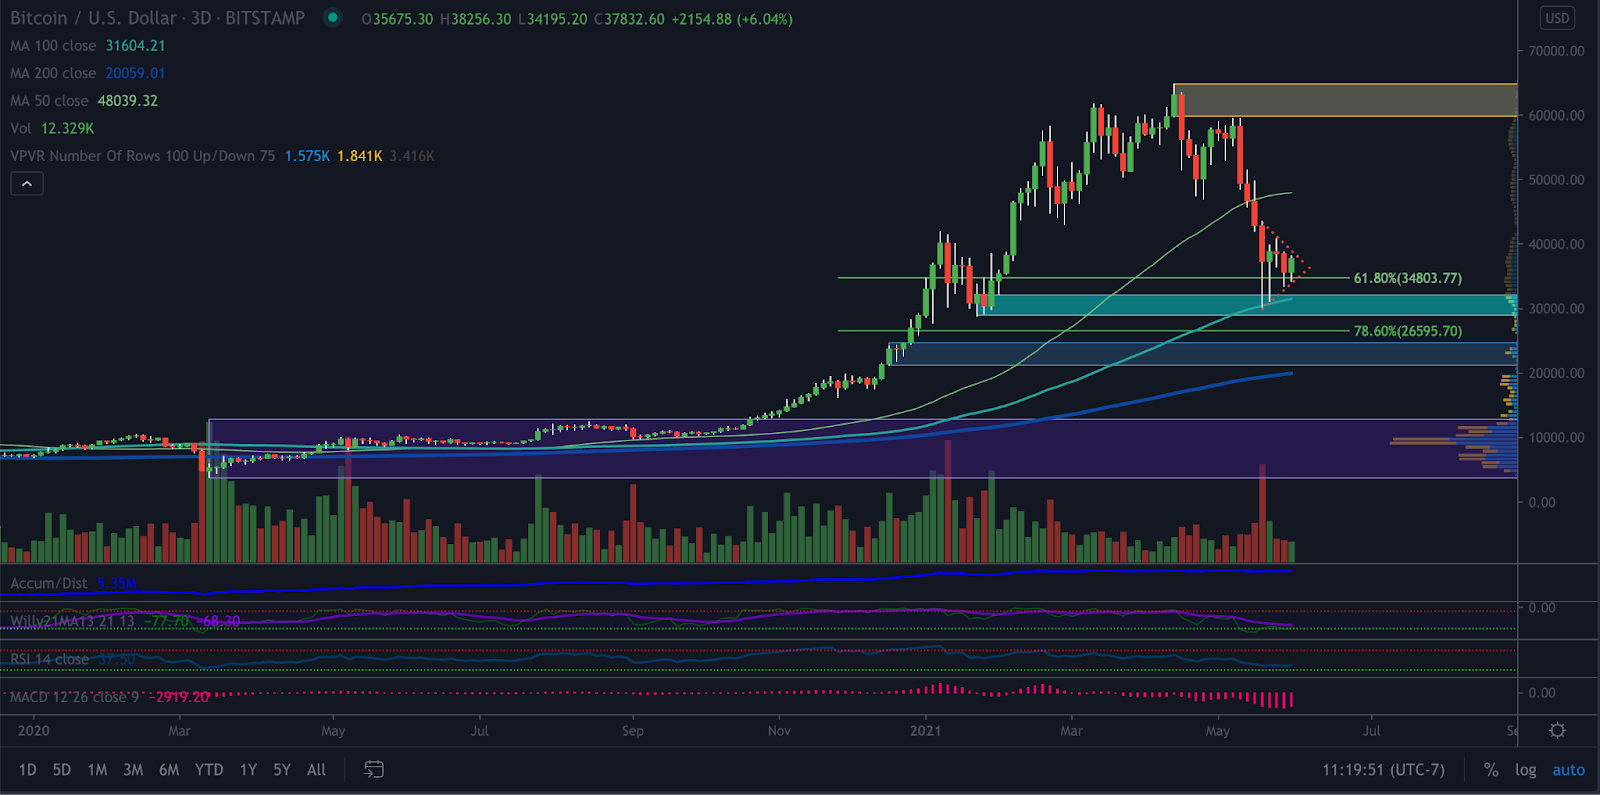
TradingView Bitstamp BTC/USD 3-day linear chart
We’ll also zoom out to the 3-day chart for a broad view of the medium-term technicals where we can see that the top of the OTE long zone and the rising 50 SMA continue to provide enough support to keep candle wicks above this area thus sparking another fairly bullish candle formation today which is keeping longer-term market structure intact while the momentum and volume indications continue to favor the bulls longer-term. That said, short and medium-term market structure remains broken and very heavy and the bearish triangle/pennant has yet to be broken on this timeframe so we want to stay neutral despite the likelihood of a run at the $40k – $42k area over the next few days due to the conference.
Trade Idea: Accumulate below $34,000 for shorter-term upside to the $42,000 area. Longer-term target resides around $100,000.
Monero (XMR) Technical Analysis & Outlook
XMR/BTC

TradingView Binance XMR/BTC daily linear chart
XMR/BTC has popped up into the OTE short zone today on a bullish candle formation that is helping shorter-term market structure while the 200 SMA reverses to rejoin the 50 and 100 SMAs in an uptrend, all of which bodes well for the bulls over the near-term. The favorable momentum oscillators should also help the bulls over the coming days, however medium-term market structure remains bearish and the volume indications leave something to be desired so we still think that a pullback is likely before a break of the key 0.0080 level.
Trade Idea: Accumulate below 0.0070 for upside to 0.0080. Longer-term target resides in the 0.0120 area.
XMR/USD

TradingView Bitfinex XMR/USD daily linear chart
XMR/USD spiked up into the resistance patch between the two yellow lines earlier today but was quickly rejected back below it as we head towards the daily close, which is not great news for the bulls, and neither is the falling 50 SMA. On the other hand, the longer-term moving averages are still rising, the momentum and volume indications are becoming increasingly favorable, and near-term market structure continues to improve so we think a run at the $300 region is likely before a pause and consolidation inside the resistance patch.
Trade Idea: Buy dips below $260 for upside to the $450 area. Longer-term target resides around $800.
Ethereum (ETH) Technical Analysis & Outlook
ETH/BTC

TradingView Binance ETH/BTC daily linear chart
ETH/BTC is now at a critical juncture following a nice rally back into the low-0.070’s last weekend considering that there is a key resistance line just overhead while price forms what appears to be an unorthodox ascending triangle and the momentum oscillators continue to flatline in no man’s land, so we think it best to stay neutral around current levels even though a breakout is quite possible and the technicals are increasingly bullish. The bearish state of medium-term market structure also remains a concern, supportive of neutrality as well, but the rising moving averages and very encouraging volume indications suggest that any dip below 0.070 is buyable for a breakout up to the 0.080 area in the not too distant future.
Trade Idea: Buy dips below 0.070 for upside to the 0.080 area. Longer-term target resides in the 0.12 area.
ETH/USD

TradingView Coinbase ETH/USD daily linear chart
Given a lack of shorter-term resistance above the 50 SMA just overhead, as well as the rising longer-term moving averages, we think that ETH/USD is looking much better than it did last week. The improving momentum oscillators, very favorable volume indications, and still bullish longer-term market structure situation also point to the bulls slowly regaining control, however we don’t expect much upside above $3000 over the near-term due to historical and technical resistance in that region.
Trade Idea: Buy dips below $2500 for upside to the $3200 area.
Pirate Chain (ARRR) Technical Analysis & Outlook
ARRR/BTC

Coinigy TradeOgre ARRR/BTC daily linear chart
ARRR/BTC has had a fantastic start to June considering that price has rallied sharply above the now broken falling wedge as well as out of the OTE long zone on some firmly bullish candle formations that are turning short and medium-term market structure positive once again, all great news for the bulls moving forward. The improving OBV reading, the favorable MACD, and a rising RSI also suggest that the bulls are back in control for now, although RSI is getting close to overbought so we think some turbulence is likely before a sustainable break of the 0.00016 resistance level.
Trade Idea: Accumulate below 0.00015 for upside to the 0.00025 area.
ARRR/USD

CoinTraderPro CoinPaprika ARRR/USD daily linear chart
ARRR/USD has been on a tear over the past several days on increasingly bullish candle formations that have shifted near-term market structure to bullish while vastly improving the medium-term outlook as well, all of which is good news for the bulls moving forward. The fact that RSI is reversing back to the upside while MACD continues to trend higher is also good news for the bulls, as are the rising moving averages and a strong OBV reading, so we think a continuation up into the $6 – $8 range is likely before a pullback and higher low materializes at resistance.
Trade Idea: Buy dips below $5 for shorter-term upside to the $8 area. Longer-term target resides around $25.
Good Luck, Good Trading!