Crypto Market Report!
(May 4th – 2023)
Bitcoin (BTC) Technical Analysis & Outlook
Following a nothing-burger of a Fed meeting yesterday and the lack of catalyzing newsflow it comes as no surprise that the bitcoin markets continue to consolidate between $27k – $30k while the US Dollar Index (DXY) is still chopping around near its lows. We continue to believe that sideways is the path of least resistance over the near-term, although a likely breakdown in the DXY towards 100 over the next few weeks should be the trigger to take prices to new local, regional, and cycle highs well above $30k before a sizeable correction materializes going into Summer.
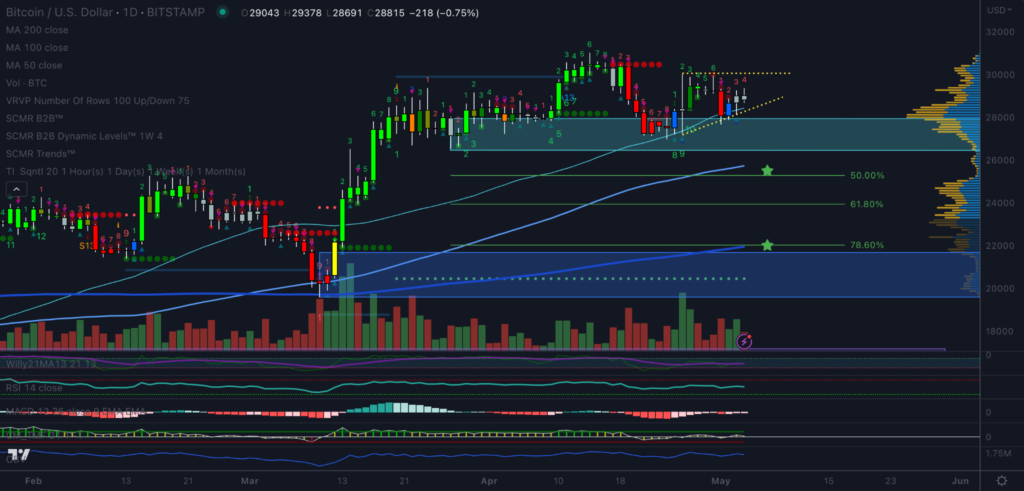
TradingView Bitstamp BTC/USD daily linear chart
First let’s take a look at the daily chart for a view of the short to medium-term technicals where we can see that a potential ascending triangle continues to form on a mixed TD count, a hodgepodge of candle formations, and steady but unimpressive momentum and volume indications, all of which points to more consolidation within the triangle until further notice. Having said that, all of the moving averages are still stacking bullishly to the upside and intermediate-term market structure remains intact, so we’ll continue to lean bullish overall despite the possibility of some downside volatility to range lows before a move above $30k once again.
Short-term Trade Idea: No short-term trade idea at this time.
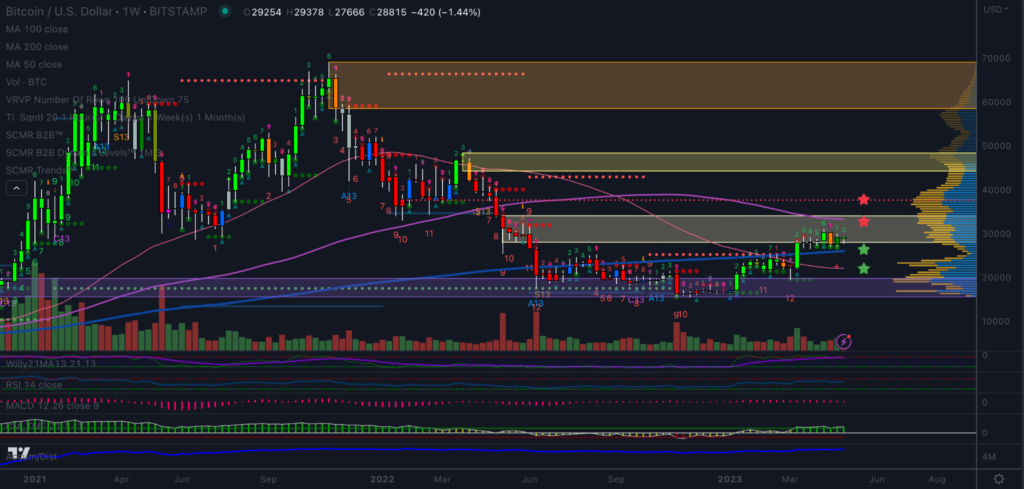
TradingView Bitstamp BTC/USD weekly linear chart
Next, we’ll look at the weekly chart to see where the longer-term technicals stand as we begin the month of May and for now the market remains poised to move higher before a larger correction materialized considering that the TD count is back to bullish (2), this week’s SCMR signal is bright green on a bullish candle formation, and market structure is still fully intact. Also, note that the 200 SMA continues to rise, the 50 SMA continues to flatten, and the momentum and volume indications remain favorable overall, therefore we’re sticking with our call for higher prices before a visit to the medium to long-term buy targets we have below $26k.
Long-term Trade Idea: Accumulate below $26k for longer-term targets in the $100k range.
Monero (XMR) Technical Analysis & Outlook
XMR/BTC
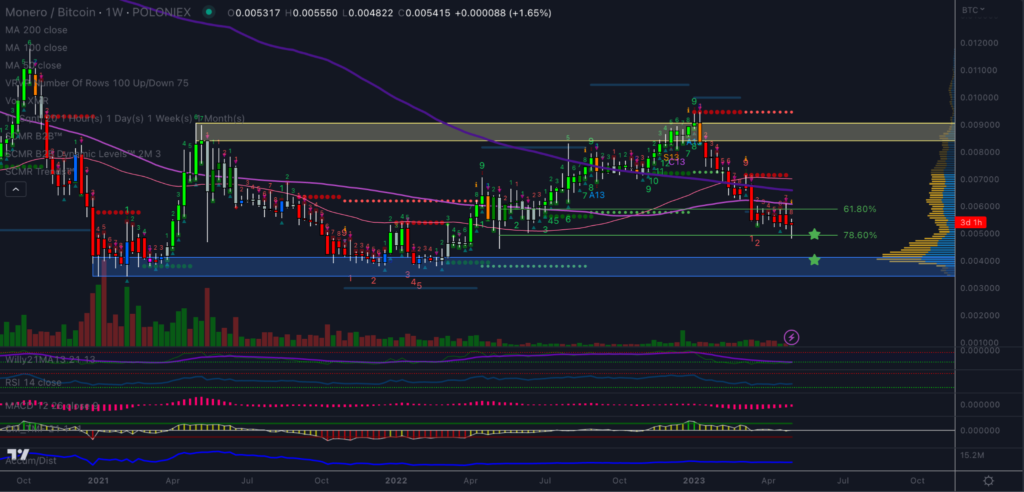
TradingView Poloniex XMR/BTC weekly linear chart
XMR/BTC moved down to new local and regional lows this week as expected on a red TD 8 count and a red SCMR signal that broke market structure once again, all signaling continued selling pressure before a bullish reversal materializes. The falling moving averages and lackluster momentum and volume indications also point to additional downside over the shorter-term, likely to retest the 0.0048 lows over the next 10 days as a TD 9 bottom develops while BTC tops.
Trade Idea: Accumulate around and below 0.0050 for a medium-term target of 0.0105 and a longer-term target of 0.0200.
XMR/USD
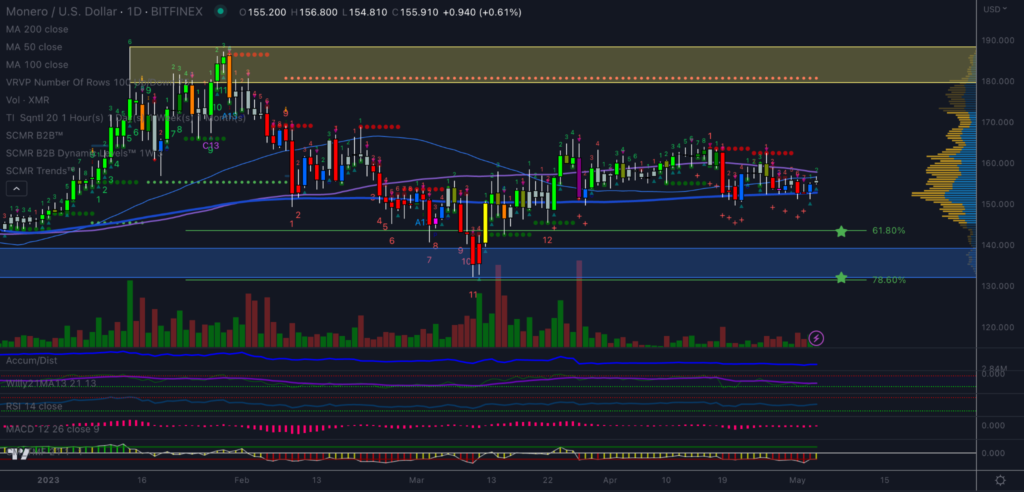
TradingView Bitfinex XMR/USD daily linear chart
XMR/USD is still consolidating in the $150s as expected on a mixed TD count, unhelpful SCMR signals, and highly uncertain market structure, all suggesting more of the same over the shorter-term. Having said that, the momentum oscillators don’t look that great and the volume indications show sellers are still firmly in control, therefore we’ll continue to stay patient for lower levels before getting more active on the long side once again.
Trade Idea: Accumulate below $150 with a medium-term target of $200 and a longer-term target of $2000.
Ethereum (ETH) Technical Analysis & Outlook
ETH/BTC
TradingView Bittrex ETH/BTC weekly linear chart
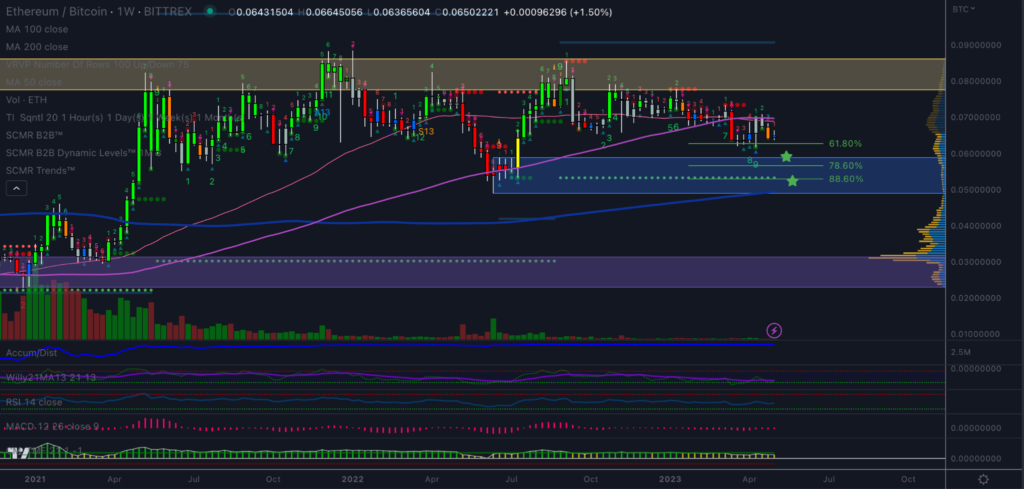
ETH/BTC has stayed surprisingly steady around the 0.065 level over the past few weeks despite some bearish indications recently such as the SCMR orange bearish pivot bar from last week, certainly a credit to the bulls so far. The volume indications also show that the bulls continue to accumulate at these levels which is a great sign longer-term, however market structure remains bearish over the short to medium-term, price is below the now falling shorter-term moving averages, and the momentum oscillators still don’t look that great right now, therefore we’ll continue to wait for slightly lower prices around the 0.060 level before adding to current positions.
Trade Idea: Accumulate around and below 0.060 for medium-term upside to the 0.080 region and longer-term upside to 0.100.
ETH/USD
TradingView Coinbase ETH/USD weekly linear chart
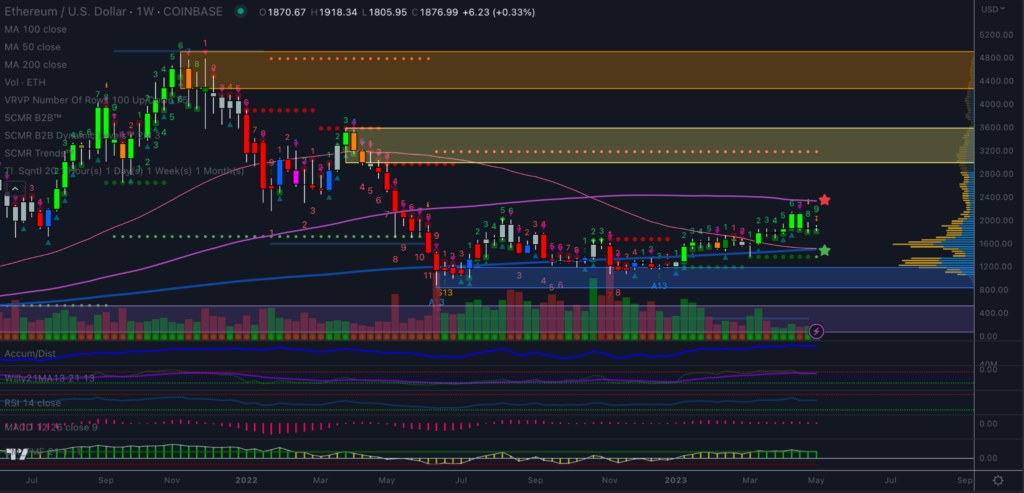
ETH/USD is flashing some warning signs right now considering that we’re on a green TD 9 top signal and a small doji candle formation while the momentum oscillators start to roll over, all of which tells us that we should be taking some profits off of the table over the next week or two (especially above $2000). Having said that, the longer-term outlook remains favorable overall so we welcome a dip in the next month or two that will give us an opportunity to add to positions closer to the $1500 level.
Trade Idea: Buy weakness below $1600 for medium-term upside to the $2300 area and longer-term upside to $10k.
Radiant (RXD) Technical Analysis & Outlook
RXD/BTC
Coinigy TradeOgre RXD/BTC daily linear chart
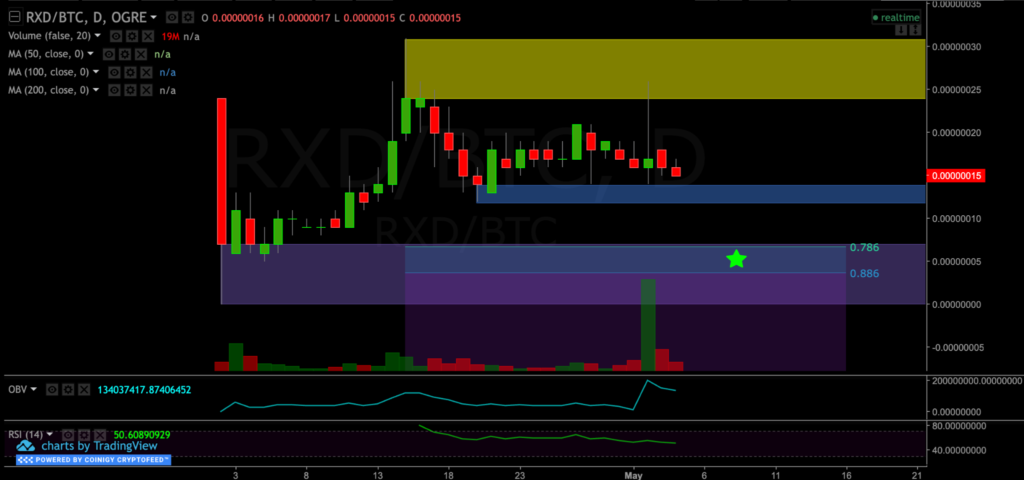
We’ll begin our RXD/BTC analysis with a look at the daily TradeOgre chart where we can see that there isn’t much price history to work with so we’ll try to keep it as simple as possible. With market structure now turning short to medium-term bearish and RSI heading steadily lower it appears that more downside is likely in the not-too-distant future, at least down to the 12 – 14 satoshis area before seeing a bounce back to the upside. That said, we believe that a more dramatic and sustained correction is likely over the coming weeks and months that targets down 80 – 90% from the highs, which puts us squarely in the 4 – 6 satoshis zone to back up the truck before the next cycle begins.
Trade Idea: Accumulate around and below the 7 satoshis level for longer-term upside to the 100 sats area.
RXD/USD
Coinigy TradeOgre RXD/USDT daily linear chart
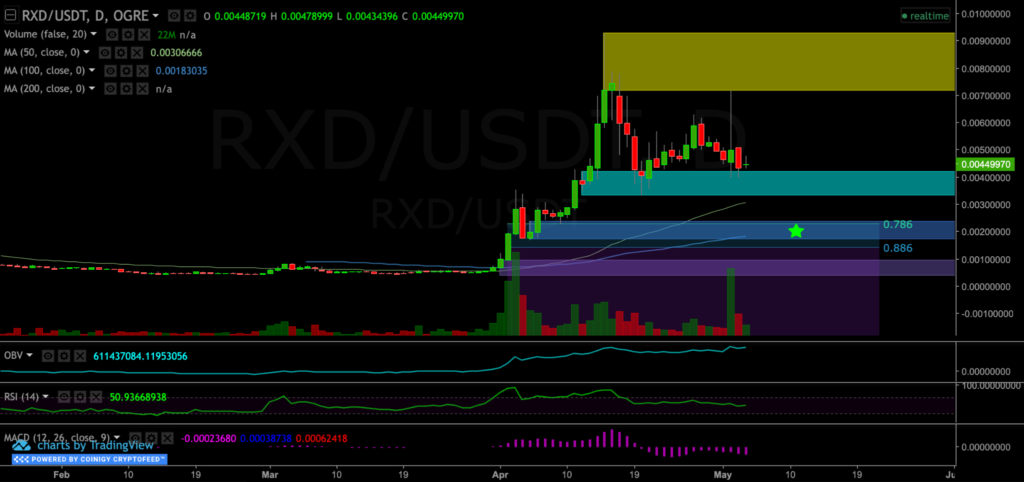
RXD/USDT is heading lower following a bull trap failure into the OTE short zone earlier this week on the pick release, with more likely to come considering that market structure is turning bearish, RSI is correcting below its 50-line, and MACD is accelerating to the downside. A lack of moving average support below the market until the low-$0.0030s is also a concern over the shorter-term, therefore we’ll wait for lower prices before trying to get active on the long side in order to accumulate a meaningful position before the next bull cycle.
Trade Idea: Accumulate around and below $0.0022 for longer-term upside to around $0.10.
Good Luck, Good Trading!