Crypto Market Commentary & Outlook
(May 13 – 2022)
Bitcoin (BTC) Technical Analysis & Outlook
Following an absolutely brutal week of price action for risk assets across the board, including crypto, things are starting to stabilize a bit heading into the weekend, which is certainly good news for holders of these assets. Given the magnitude of the volatility over the past several days, we think that the BTC and alts are due for a pause/ period of relative calm before more movement besets the market in the not too distant future. That said, while we would love to be able to call a bottom at $25,401, the technicals are still leaning towards more downside from the low-$30k’s either to test the lows or produce one more washout from which we can really move.

TradingView Bitstamp BTC/USD 6-hour linear chart
First up is the 6-hour chart for a view of the shorter-term technicals where we can see that price appears to have already topped out around the $31k level on a 4 candle TD correction to the upside following a TD 8 signal yesterday, all of which is less than optimal for the bulls. Still bearish market structure, lackluster volume indications, and falling EMA’s are also bad news for the bulls moving forward, however a higher low in the $26 – $27k’s on the next downdraft would turn us decidedly more bullish. That said, a breakdown back below $26k likely leads to the $23 – $24k area that we’ve discussed for a while, another spot to accumulate for the longer-term.
Short-term Trade Idea: Buy weakness between $26k – 27k for shorter-term upside to $32k.

TradingView Bitstamp BTC/USD daily linear chart
We’ll also take a look at the daily chart to see where the technicals stand following this abysmal week and we are starting to see some signs of a bottom for now such as the TD 9 buy signal, oversold momentum oscillators, and improving money flow, so we’ll continue to nibble at key levels to the downside when given the opportunity. Having said that, the bias does remain lower until further notice considering that SCMR signals are still red, candle formations are suboptimal, all of the moving averages are heading lower, the 50 SMA has crossed below the 100 SMA, and the volume indications remain discouraging overall, therefore we still think that a retest of the lows or one more new low is in likely before a serious rally can commence.
Long-term Trade Idea: Accumulate below $24k for longer-term upside to the $120k area.
Monero (XMR) Technical Analysis & Outlook
XMR/BTC

TradingView Binance XMR/BTC daily linear chart
XMR/BTC is trying to find its footing in the 0.0050 area on some nice bullish momentum and volume divergences following a large selloff down to the 0.0045 region earlier in the week, a decent sign for the bulls moving forward, however SCMR signals are still red, candle formations leave something to be desired, the TD count is firmly bearish, and money flow remains highly negative so we’ll stay on the sidelines until either a successful retest of the lows or a breakout above resistance around 0.0055.
Trade Idea: Hold current positions for shorter-term upside to the 0.0055 area. Longer-term target resides around 0.0100.
XMR/USD

TradingView Bitfinex XMR/USD daily linear chart
XMR/USD is still looking pretty bad technically speaking despite a bounce back to the $150 region due to the still fairly bearish candle formations, red SCMR signals, bearish TD count (7), atrocious looking volume indications, and falling moving averages, all of which suggest that the bearish bias remains intact. The lack of any major bullish divergences is also a concern for the bulls, hence we’ll stay neutral until/unless a successful retest of the lows or a test of the key long-term support area around $100 materializes.
Trade Idea: Hold current positions for medium-term upside to the $200 area. Longer-term upside resides around the $1200 level.
Ethereum (ETH) Technical Analysis & Outlook
ETH/BTC

TradingView Binance ETH/BTC 3-day linear chart
ETH/BTC has fallen below the 0.070 level this week on a large red SCMR signal and bearish candle formation while the TD count goes bearish again and new SCMR resistance dots materialize overhead, all suggesting that the bears are now in control. Negative money flow and worrying momentum oscillators are adding to the bear case for now, so lower prices are likely in the near future, although the 0.065 area remains a major support confluence so that’s where we should see some bullish action. If not, then we’ll move firmly to the sidelines until a definitive bottom is in given the risks to the downside if support is broken.
Trade Idea: Buy weakness around the 0.065 level with a shorter-term target of 0.072. Longer-term target resides around 0.100.
ETH/USD
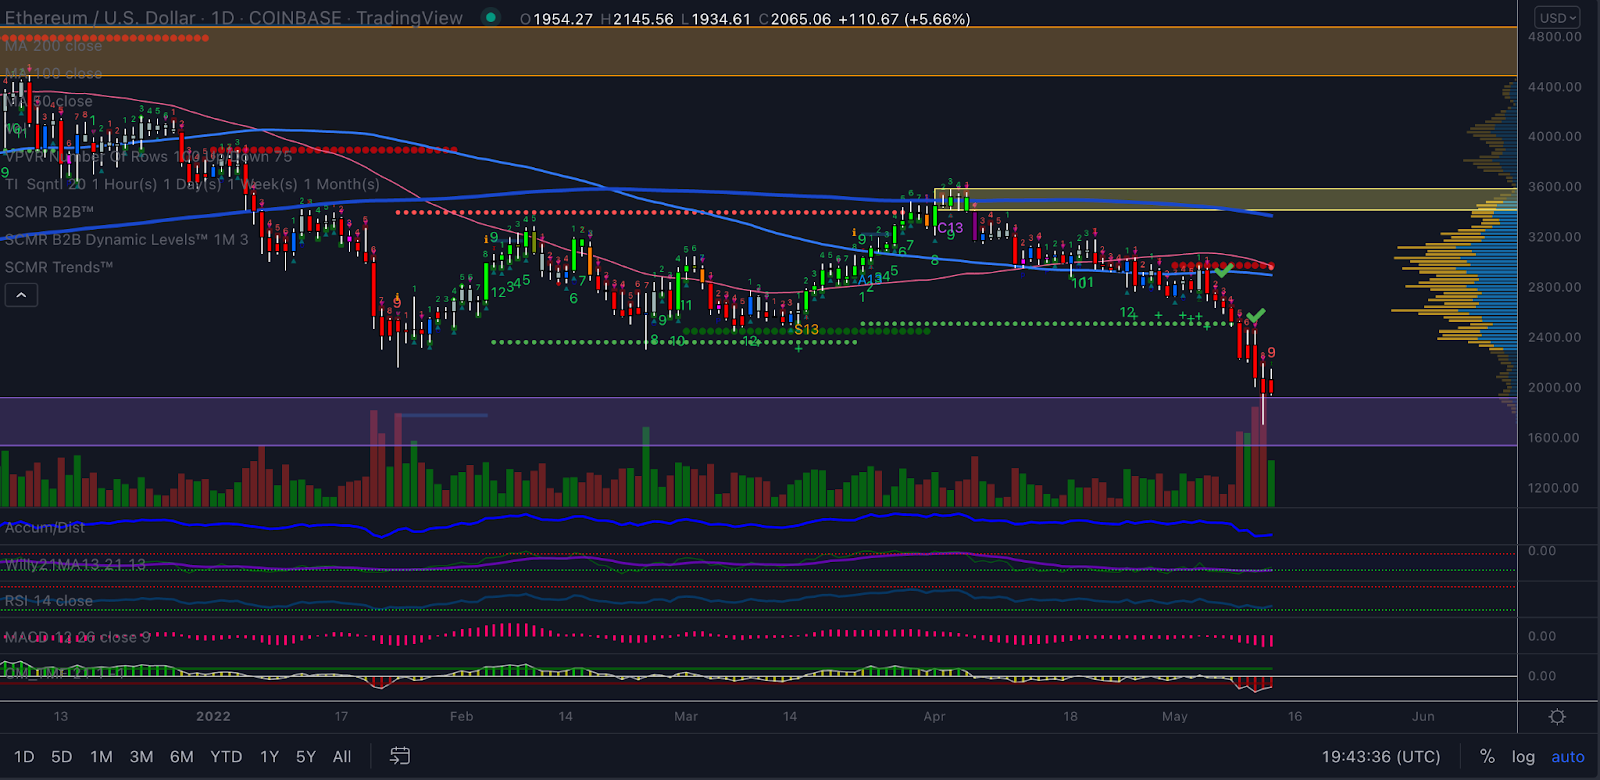
TradingView Coinbase ETH/USD daily linear chart
ETH/USD fell below the key $2000 level yesterday and is now trying to stabilize around there despite the technicals still looking pretty bad, so we certainly need to remain highly cautious until more signs of a sustainable bottom develop. Right now SCMR signals remain red, candle formations are not bullish, market structure is broken, the 50 SMA is falling, the volume indications look awful, and we still don’t have any major momentum divergences, so we want to stay on the sidelines for now. That said, we do have a TD 9 buy signal as price tags the top of the demand area and bounces, so we’ll be watching for a successful retest of the lows in order to get more bullish.
Trade Idea: Hold current positions for shorter-term upside to the $2400 area. Longer-term target remains around $12,000.
Pirate Chain (ARRR) Technical Analysis & Outlook
ARRR/BTC

TradingView Kucoin ARRR/BTC daily linear chart
Following a massive washout to the downside to the 0.00002200 level for ARRR/BTC, prices are now recovering quickly off of the lows on some bullish momentum and volume divergences while price bounces off of a historically significant support area, all pretty good news for the bulls overall. That said, the bad still far outweighs the good considering that SCMR signals remain red, candle formations are unconvincing, the TD count is still bearish, market structure is broken, and the 50 SMA is falling. While we think we are getting close to a tradeable bottom, like almost every other coin we need to see a successful retest of the lows or else much lower prices (and hence more pain) is coming to the market.
Trade Idea: Hold current positions for shorter-term upside to the 0.00003200 region. Longer-term target resides in the 0.00010000 area.
ARRR/USD

TradingView Kucoin ARRR/USDT daily linear chart
ARRR/USDT has taken a serious beating over the past several days reaching a local and regional low of around $0.62 before bouncing sharply higher over the past 24 hours on oversold momentum and a bullish MACD divergence, which is decent news for the bulls moving forward. Having said that, almost all of the other technicals remain in a bearish stance such as SCMR, TD count, market structure, volume indications, and the 50 SMA, so we’ll just move to neutral with our current holdings until we see clearer signs of an imminent reversal.
Trade Idea: Hold current positions for shorter-term upside to the $1.00 area. Longer-term target resides around the $12.00 level.
Good Luck, Good Trading!